Content Marketing KPIs – 18 Essential Content Metrics
Bounce Rate? CTR? Time on Site? Thanks to web analytics tools like Google Analytics and Parse.ly, we can easily capture content metrics today. Key performance indicators (KPIs) are essential for measuring success in content marketing. However, around half of all marketers don’t know how their content is actually performing.
In fact, measuring success in content marketing is notoriously difficult. Content marketing usually aims for long-term success. Potential customers rarely land on a blog post and then make an immediate purchase. Content is more about slowly building trust in the brand over multiple touchpoints. It is often unclear to what extent content marketing has ultimately contributed to closing the deal.
That’s where Content Marketing KPIs come in handy. The best KPIs to evaluate content will primarily depend on your goals. Better conversion rates? Higher traffic? More engagement? This will determine what different metrics are important. The content format also plays a role. Of course, the success of a podcast is measured differently than that of a study.
Read on to learn why Content Marketing KPIs and metrics are not the same, which 18 important metrics you should be tracking for your content marketing, and how to interpret them.
What are content marketing KPIs, metrics, and goals?
Typically, companies aim for one of three goals in content marketing:
- Higher sales – more conversions
- More traffic
- Better reputation among users and search engines
KPIs measure to what extent these goals are achieved.
KPIs are geared to specific business goals and timeframes in most cases. On the other hand, metrics represent pure data that is collected without any connection to a specific goal. By themselves, metrics don’t indicate anything about the marketing’s success. So every KPI consists of at least one metric, but not every metric is also a KPI.
For example: If you have declared higher user engagement as the goal of a content marketing measure, the number of interactions on your blog would be a conceivable KPI. This KPI could then be derived from several metrics such as the number of page views per session, downloads made, and comments left.
Without KPIs, your company won’t have a direction, no matter how many metrics you track. Nor will you get far with the wrong KPIs. KPIs must be relevant to the company’s success, measurable, and easy to understand. They must enable decision-makers to quickly sort out the data and monitor whether the company is developing in the desired direction.
Higher reach as the content target
If your content marketing strategy is mainly about reaching a wider audience and increasing visibility, consider turning the following traffic metrics into your KPIs:
The most obvious metric for traffic measurement is probably the number of pageviews. This metric indicates how many times your pages have been viewed in total. It doesn’t matter if the user is new or returning, nor if they visit multiple pages, each view is recorded. . You cannot determine how many visitors your content has attracted. If a single user visits more than one of your pages, all visits are included in the count. Thus, pageviews leave some questions unanswered. This metric needs to be combined with several others to become meaningful.
Unique pageviews are more suitable. Google Analytics displays unique pageviews under Audience>Overview as “Users.” Here, only one unique pageview is recorded per new visitor to your domain, even if this visitor has clicked on several of your subpages. However, this KPI on its own is not without its flaws. Clickbait headlines might attract lots of visitors to your pages only to have them immediately leave. Also, consider that a user who visits your site on two different devices will be counted twice. Moreover, not every unique pageview is of equal value. A study visit is much closer to a conversion than a view on the team page.
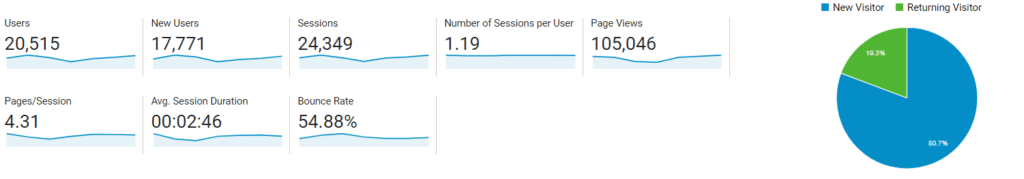
Check the new vs returning visitor report for more qualitative insights on your traffic. You will find this in the Google Analytics Audience Report as well. Here you will see how many visitors have already seen your content pieces. A high number of returning visitors indicates that your content is working. You already have a good reputation with returning visitors and are possibly on the verge of conversion. Now you need to determine what kind of content attracts many returnees and produce more of it.
You can also estimate your reach in search engines using the impressions metric. This metric is easily found in the Google Search Console. It shows how often users have seen a link to your page. If you are, e.g., on page 3 of the search results, but a user scrolls only to page 2, no impression will be displayed. Having many or increasing impressions means you frequently appear high up in the SERPS and are well visible to the search engines. Even if your results are not clicked on Google, potential customers will still become aware of your brand.

Reputation as Content Marketing Goal: Qualitative Metrics
We see up to 10,000 ads every day. Faced with this information overload, we automatically filter for known and trusted sources. Building trust is, therefore, a valid content marketing goal. From new customers and applicants to existing clientele or industry analysts, your company will be directly associated with the quality of your content. Appropriate content quality will establish your business as a thought and quality leader.
User Reputation – Content Engagement KPIs
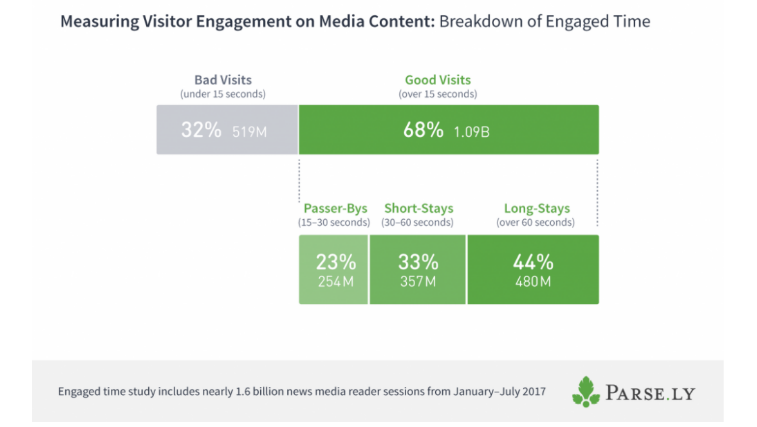
Google recognizes good content by the feedback of the users. If visitors come to your page and leave again after a few seconds, this is a bad sign. Time-on-page is, therefore, an important content KPI. It is generally good in content marketing if visitors stay longer on your pages. This means your blog posts are actually being read. However, the context of the page also plays a role. High dwell times on product or check-out pages may indicate that your content is difficult to navigate.
Tracking tools usually calculate dwell times based on entry/exit events. The assumption is that users interact with a page from the moment they open it to the moment they close it. However, this is often not the case, e.g., when users open the page but are on another tab or not even at their computer at all. The engaged time metric only tracks the time users scroll, click, and interact with the page. This metric is, therefore, more suited to measure true content engagement.
Engaged time KPIs and dwell times should always be considered with bounce rates. The bounce rate shows how many users bounce off the page without any interaction. High bounce rates and short dwell times often indicate significant problems like long loading times or a bad first impression of your site.
Many social media comments and shares are an obvious sign of high user interaction. Of course, don’t just look at the mere number of ratings but also whether they are positive or negative. Various sentiment analysis tools can show how well you are received on social media.
A relatively advanced content metric is scroll depth. Tools like Hotjar use scroll maps to show how deep visitors have dived into your content and which page areas have been interacted with the most.
Content longevity is especially interesting for smaller content marketing teams. If you can only produce a few posts per week, it’s advantageous if these generate traffic for longer periods of time. With tools like Parse.ly, you can filter which of your content has what it takes to become evergreen content.
Reputation in search engines – SEO KPIs
Besides the users’ judgment, your authority with the search engines is also crucial. The higher your “domain authority,” i.e., your reputation with Google, the easier you will rank for target keywords.
The most important factor determining the authority of your domain is backlinks. In fact, most pages have no backlinks at all. A site with many incoming links, preferably from reputable sources, appears trustworthy to search engines as well as users. If recognized industry authorities recommend their audience your content, this is a powerful sign. The Ahrefs Backlink Checker is free and even shows your link source’s authority.
A popular SEO KPI is the visibility index. Various tools, most notably Sistrix, use this to calculate how your pages rank for a specified pool of over 1 million keywords. However, this is not suitable for all companies. If you are mainly targeting long-tail keywords, your visibility will automatically be lower, as such keywords are probably not included in the pools. Local SEO also overwhelms these indexes. A company can rank very well locally despite having low visibility in general.
The clickthrough rate determines the number of users your links were shown to that also clicked on the page. You can find this rate in the Google Search Console. If the clickthrough rate is low, you may have missed the search intent, or there might be something wrong with your snippets. Often, overly long or short meta descriptions are poorly received. Many emojis, arrows, or exclamation marks can look spammy in the title. Also, make sure your URLs are as concise as possible and descriptive of the page’s content.
A high clickthrough rate for internal links means that readers like your content and want more of it. The average number of pages per session tells you whether a visitor to your content has subsequently engaged further with the website. The aim of the content is often to direct visitors to other company pages, ideally to realize a conversion there. A positive sign, especially for blogs, would be many pages per session combined with high dwell times. The number of pages per session can be found in the GA Acquisition Report.
Conversions as a content marketing goal – Conversion KPIs
High traffic and a good reputation are a good start, but most businesses also expect content marketing to yield leads and conversions. And sooner or later, having a few KPIs to present to the boss that is more directly linked to the business account will be beneficial:
Content marketing is often primarily implemented for lead generation. And in fact, leads are a valuable content KPI. When visitors sign up for your newsletter or download a study they “pay” by giving you their email addresses. Thus, your content has some value to those leads. You should also track what content is producing particularly qualified leads and why. However, leads are not a meaningful KPI for every type of content. If the content is only informative or meant to build customer loyalty, they don’t matter as much.
The metric cost per lead often becomes a KPI to calculate the content ROI based on the leads. Here, the complete campaign costs are divided by the number of leads achieved. This makes it easy to compare content performance on different channels. In general, however, this metric is rather unsuitable for measuring content marketing success. The content team cannot influence many aspects of the offer, such as product quality or cost-effectiveness.
Conversion rates are usually calculated by dividing the number of conversions by the total number of visitors. What constitutes a conversion on a particular page is up to you. Often it will be a click on the CTA. The conversion rate is a popular content KPI. However, be sure to interpret them in the context of the content’s position on the Customer Journey. You will often observe lower conversion rates in earlier stages of the journey. CTAs also need to be adapted to the position of the content. You don’t want a “Buy now!” button too early in the customer journey. Also, the conversion rate is a relative metric; high conversion rates on pages with meager traffic won’t get you very far.
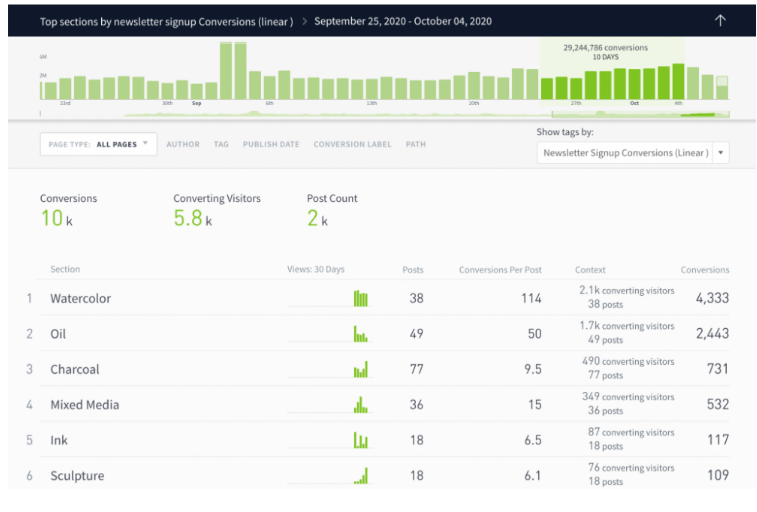
The conversion attribution metric lets you determine what content visitors saw before they made a purchase or another type of conversion occurred. This allows you to understand exactly what path a subsequent customer took through your content. You can determine a customer’s first contact with your content and which page was viewed just before the conversion. Parse.ly’s linear attribution model even displays all the content a subsequent customer has seen.
Work with Content Experts
From trying to boost reputation, over conversion optimization, to traffic generation. Content marketing will often pursue goals that are only indirectly related to the company’s financial success. Individual KPIs are not enough to properly evaluate the performance of the content. Depending on the type of content, position in the customer journey, search intent or goal of the content, different metrics are relevant.
The DSGVO-compliant planning and implementation of a tracking concept in a website relaunch, or in an existing project, is a challenging task. To ensure that you track all important KPIs for your content, contact our content analytics experts.